
How to Measure Content Performance: A Complete Guide
Published on 2025-09-11
Measuring your content's performance is all about connecting your creative work to real business results. It’s a process of setting smart goals, tracking the right KPIs, and digging into the data to see what’s truly moving the needle.
This means looking past simple numbers like page views and digging deeper to understand how your content actually engages people, brings in leads, and builds a loyal following.
Your Guide to Understanding Content Performance
Ever feel like you're drowning in data but still can't answer one simple question: "Is my content actually working?" You're not alone. So many marketers get caught up chasing vanity metrics. But real content performance measurement is about figuring out what truly clicks with your audience and drives your business forward.
Think of this process as the foundation of your entire content strategy. Without it, you’re just creating content in the dark and hoping for the best. When you have a solid measurement plan, you replace guesswork with a system that you can repeat for success. This boils down to a few key ideas:
- Look Beyond the Surface: Sure, page views and likes feel good, but they don't paint the full picture. The real story is in metrics that show genuine interest—things like time on page, conversion rates, and bounce rates.
- Tie Everything to Business Goals: At the end of the day, you want to see how your blog posts or LinkedIn updates are helping the business. Are they generating leads? Driving sales? Keeping customers happy?
- Create a Feedback Loop: The data you collect is pure gold. Use those insights to shape your next wave of content, fine-tuning everything from the topics you choose to the formats you use.
Why Measurement Matters More Than Ever
The way we look at content performance has changed a lot. It’s no longer enough to just publish something and count the shares. We need a much more strategic approach.
Consider this: 83% of marketers say content is their top tool for generating demand, and 63% agree it’s crucial for building customer loyalty. These numbers show a clear link between great content and business value. If you're curious about the latest trends, you can explore more stats on how content drives business results.
To get a handle on this, it's helpful to break down the core components of a good measurement strategy. This table sums up the pillars that will support your efforts.
Core Components of Content Performance Measurement
| Component | What It Is | Why It Matters |
|---|---|---|
| Goal Setting | Defining clear, specific outcomes for your content (e.g., generate 50 MQLs). | Gives you a target to aim for and a benchmark for success. |
| KPI Selection | Choosing the key metrics that directly track progress toward your goals. | Helps you focus on data that matters and avoid vanity metrics. |
| Tool Implementation | Setting up analytics tools to collect and organize your data automatically. | Provides the raw data you need for analysis without manual headaches. |
| Analysis & Reporting | Regularly reviewing the data to find trends, insights, and actionable takeaways. | Turns raw numbers into a story that informs your next steps. |
| Optimization | Using your findings to make strategic changes to future content. | Ensures your content strategy is always improving and evolving. |
Each of these components builds on the last, creating a cycle of continuous improvement for your content.
The core principle is simple: what gets measured gets improved. If you're not tracking performance, you're missing critical opportunities to refine your strategy, double down on what works, and eliminate what doesn't.
Ultimately, learning how to measure performance is what turns your content from a line item in the budget into a powerful engine for growth. For a deeper dive, check out this ultimate guide to content performance measurement, which really gets into the nitty-gritty of key metrics and strategies. It's a fantastic starting point for building your own framework.
Tying Your Content Goals to Real Business Results

Before you dive into a single metric, you have to ask yourself the most important question: "What does success actually look like for us?" Honestly, measuring your content's performance is a waste of time if you haven't defined the finish line. This is where you connect what you're creating to the outcomes the business actually cares about.
It's easy to fall into the trap of tracking vanity metrics just because they're there. Don't do it. Instead, start with your core business objectives and work backward. Every post, article, or video you create needs a job, whether that's building trust with a new audience, pulling in qualified leads, or helping your sales team close deals.
So, if your company's big push this quarter is to grow the sales pipeline, your content's primary mission is probably lead generation. The metrics you track must reflect that specific goal.
Choosing KPIs That Actually Matter
Picking the right Key Performance Indicators (KPIs) is everything. A KPI isn't just a number; it's a vital sign that tells you how close you are to achieving a specific business goal.
Let’s get practical and break down how this looks for two of the most common content goals I see.
Goal: Building Brand Awareness
If your main goal is to get your brand name in front of more of the right people, then just looking at website traffic won't cut it. You need to measure your influence and presence within your industry.
- Social Reach and Impressions: This is your starting point. It shows how many unique people saw your content on platforms like LinkedIn. Think of it as a direct measure of your content’s visibility.
- Share of Voice (SoV): This is a great one. It compares your brand’s mentions against your top competitors. It helps you answer, "How much of the conversation in our niche do we actually own?"
- Branded Search Volume: Are more people searching for your company by name? An increase here is a massive signal that your brand awareness efforts are paying off.
The real insight here is that brand awareness isn't just about getting eyeballs on your content. It’s about making a memorable impact on the right audience, and your KPIs should measure influence, not just traffic.
Goal: Driving Lead Generation
Okay, this is where the rubber meets the road. When your content is built to fill the sales funnel, your metrics have to be directly linked to conversions and the health of your pipeline.
- Conversion Rate: This is the classic. It's the percentage of people who take a specific action after engaging with your content, like downloading a whitepaper or signing up for a webinar.
- Marketing Qualified Leads (MQLs) from Content: Go a step deeper. Track how many leads from your content are good enough to pass along to the sales team.
- Cost Per Lead (CPL): This metric keeps everyone honest. Calculate exactly what you're spending on creating and promoting content to generate a single lead. It's a crucial measure of your efficiency.
By tying specific metrics to concrete business goals, you stop counting clicks and start demonstrating real, tangible value. This is the core of any solid content performance analysis framework. It makes sure every piece of data you look at helps you make smarter decisions and, most importantly, prove the impact of your work. Your dashboard should tell a story about business growth, not just website activity.
Building Your Content Analytics Toolkit

Alright, you've got your goals locked in. Now comes the fun part: setting up the tech to see if you’re actually hitting them. Building a solid analytics toolkit isn't about collecting the flashiest tools. It's about picking the right ones that give you the full story.
A lot of people fall into the trap of relying on a single platform. They'll live and die by Google Analytics, but that only shows you what happens once someone lands on your website. To truly understand your content's journey, you need to see the whole picture—from the social post that grabbed their attention to the search query that brought them to you.
The Core Platforms for Content Measurement
Think of your toolkit as having three crucial layers. Each one offers a different lens on your performance, and when you put them together, you get a complete, 360-degree view.
Web and Engagement Analytics: This is ground zero, and Google Analytics 4 (GA4) is the non-negotiable cornerstone. It’s built around user-centric metrics like engaged sessions and conversion paths, moving beyond the old-school pageview-counting. It's also critical to keep up with major platform shifts, like understanding the transition from Universal Analytics to newer platforms.
Social Media Analytics: When it comes to LinkedIn, start with the built-in analytics. It's your most direct source for post reach, engagement rates, and who your audience is. But if you’re juggling multiple channels, tools like Sprout Social or Agorapulse are lifesavers. They pull all that social data into one place so you're not hopping between tabs all day.
SEO and Visibility Tools: How are people even finding your content? That’s where tools like Ahrefs or Semrush come in. They’re indispensable for tracking keyword rankings, seeing who is linking back to your content, and figuring out how much of the search conversation you own.
This layered approach means you’re tracking everything—not just what happens on your site, but how people discover your content and talk about it elsewhere.
The point isn't to get lost in a sea of dashboards. It’s to build a smart system where each tool answers a specific question. GA4 tells you what users do, LinkedIn Analytics shows you how they engage, and Semrush reveals how they find you in the first place.
This isn’t just theory; it’s how the pros do it. Surveys show that while 86% of marketers track website traffic, a nearly equal number (83%) also keep a close eye on social media interactions.
When it comes to connecting content to actual revenue, the most common setup is Google Analytics (used by 64% of marketers), followed by social media analytics tools (44%), and SEO platforms (34%). Picking the right mix for your goals is the key to measuring what really matters.
Turning Data into Actionable Insights
Collecting data is just the beginning. The real skill is turning those numbers into a story that tells you exactly what to do next. This is where you shift from just knowing what happened to finally understanding why. It's all about finding the patterns that show you what your audience really cares about.
Think about it: a high bounce rate on a key landing page isn't just a bad number. It's a flashing red light telling you there's a disconnect between what people expected and what they got. On the flip side, if your video content consistently brings in better leads than your blog posts, that’s a huge clue telling you where to put more of your time and money.
This chart breaks down three of the most crucial metrics: traffic, engagement, and conversions. They're the foundation of any good performance analysis.
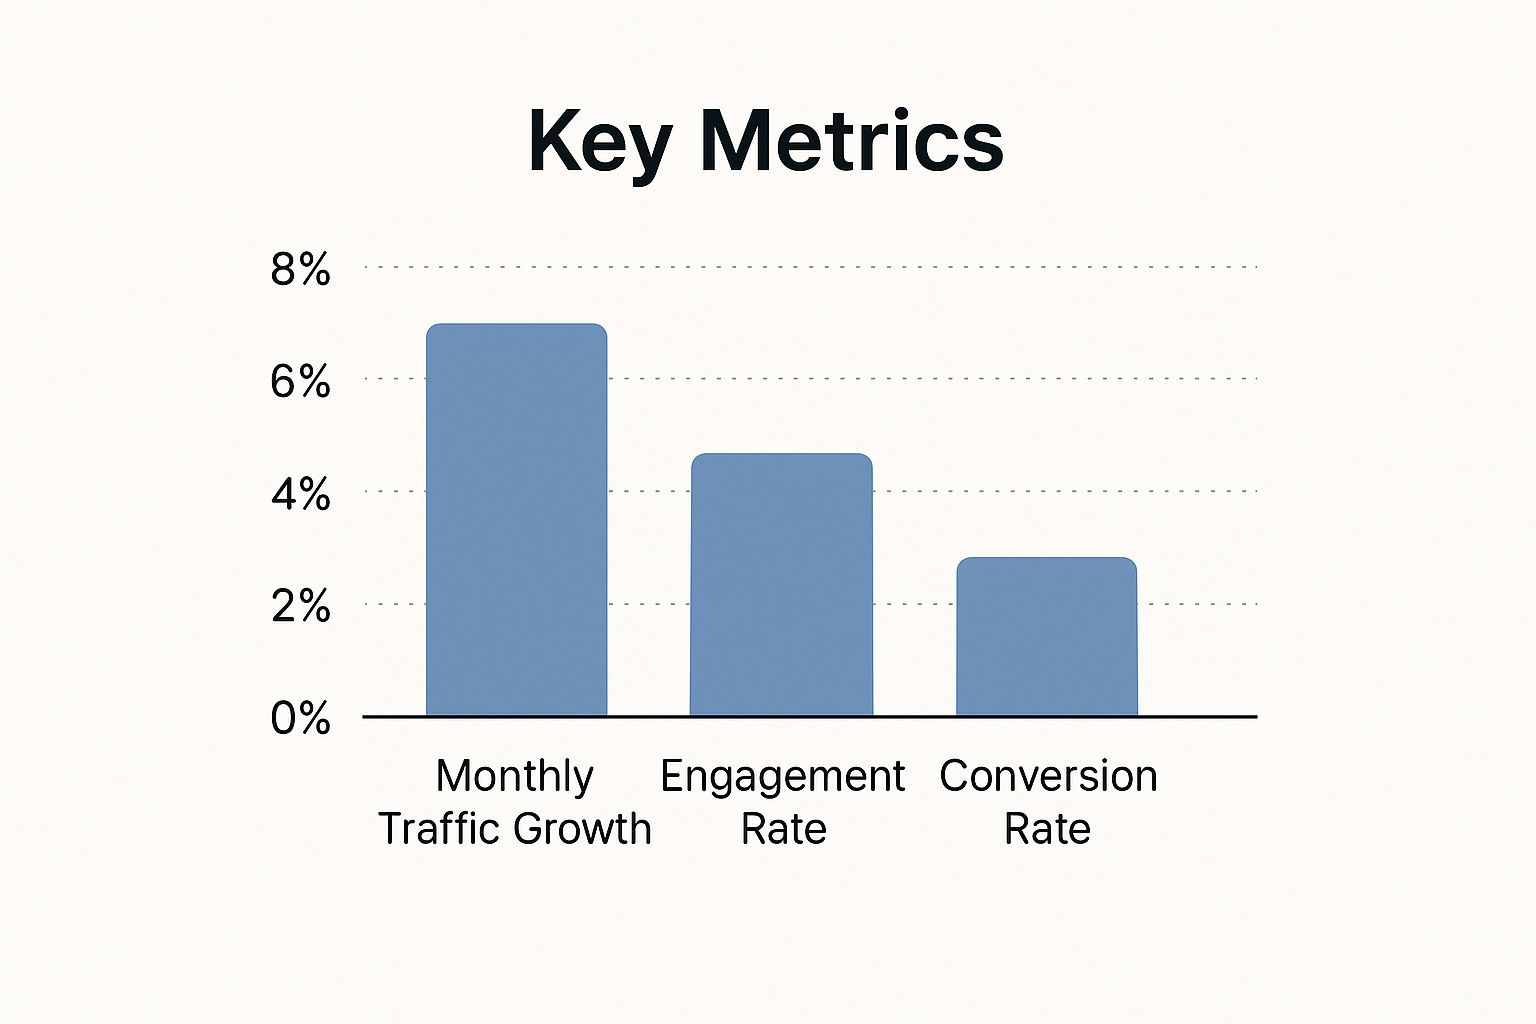
As you can see, it's all about balance. A ton of traffic is great, but it only really matters if people are sticking around, engaging, and eventually converting.
Conducting a Simple Content Audit
You don't need a complex, time-sucking process to start making sense of your data. A simple, regular content audit is one of the most powerful things you can do. The whole point is to figure out what's working and what's not.
Just open up a spreadsheet and start sorting your content. I find it easiest to group everything into three main buckets:
- High-Performing Content: These are your superstars. They nail your main KPIs, whether that's bringing in traffic, getting leads, or sparking conversations.
- Underperforming Content: These are the pieces that just didn't land. They missed the mark and failed to connect with your audience.
- Content to Update: This is the content with untapped potential. Maybe it gets decent traffic but isn't converting, or it's an old post on a topic that’s suddenly relevant again.
Once you have your lists, the real fun begins: figuring out why. Do your top-performing pieces have something in common? Maybe they're all case studies or in-depth tutorials. For a deeper dive on what to look for, check out these essential content performance metrics.
Looking at the Bigger Picture
Context is everything. Looking at one month of data in a vacuum won’t tell you much. The real insights pop out when you start comparing different time periods and slicing your data by audience segments.
Start asking bigger questions that force you to zoom out:
- How does this quarter stack up against the last one?
- Did that big holiday campaign get more traction than our summer promo?
- Are new visitors behaving differently than our regulars?
Your job isn't just to report stats; it's to find the story hidden in the data. Answering these kinds of questions is what turns you from a data collector into a strategist.
This is how you develop smart hypotheses to test later. For example, you might notice that content shared in your email newsletter has a 30% higher conversion rate than content you post on social media. Boom—that’s an actionable insight. It tells you that your email list is a goldmine of engaged prospects, and you should probably double down on it for your most important campaigns.
Digging into your numbers this way is a skill in itself. If you're working with feedback or survey results, you can learn more about mastering survey data analysis to pull out these kinds of powerful insights.
Turning Your Insights Into a Smarter Content Strategy

Collecting data is one thing; actually using it is where the magic happens. This is the part where you stop just looking at numbers and start turning them into a real-world plan for better, more impactful content.
Think of it as creating a feedback loop. What you learn from your last post directly informs what you create for your next one. It’s not about hitting a home run every single time, but about consistently getting better with each piece of content you publish. You learn, you adjust, and you evolve.
Learning from Your Winners and Losers
First things first, you need to separate the hits from the misses. It’s a simple exercise, but it's incredibly revealing. You’ll quickly start to see patterns in what your audience loves and what they scroll right past.
For the stuff that worked, your job is to figure out how to do more of it. For the duds, the goal is to understand why they fell flat so you don't make the same mistake twice.
Here are a few ways to put this into practice:
- Breathe new life into your classics. Got a blog post that’s still getting traffic but is a little dated? Go in and update the stats, add some fresh examples, or embed a new video. This keeps your evergreen content truly evergreen.
- Repurpose what people love. If a particular post absolutely killed it, don’t just leave it there. That’s a clear signal your audience wants more on that topic. Slice it up into an infographic, turn the key points into a short video for LinkedIn, or create a few eye-catching quote graphics.
- Perform a post-mortem on the flops. Take a hard look at the content that didn't perform. Was the headline boring? Did you get too niche with the topic? Honestly, you often learn more from your failures than your successes.
Your content data is a direct line into what your audience actually cares about. The trick is to listen closely, double down on the topics and formats they engage with, and gracefully retire the ones they don't.
Creating a Culture of Continuous Testing
The best content creators I know never assume they have all the answers. They’re constantly testing, tweaking, and trying to beat their own best efforts. This is where A/B testing becomes your secret weapon—it takes all the guesswork out of the equation.
You don't have to test everything all at once. Start with the elements that make the biggest first impression:
- Headlines: Try pitting a straightforward, benefit-focused headline against one that asks a compelling question.
- Calls-to-Action (CTAs): Does "Get Your Free Guide" perform better than the more direct "Download Now"? You won't know until you test it.
- Visuals and Layout: See what happens when you add more images, use more white space, or break up long paragraphs with blockquotes.
These small, focused tests add up over time, leading to major improvements in your results. This process is a fundamental part of any solid social media content planning, allowing you to refine your strategy with real feedback, not just hunches.
Ultimately, the goal is to shift your focus from just getting traffic to earning genuine attention. That's why so many marketers now prioritize ‘engaged sessions’—where someone stays on the page for more than 10 seconds and actually interacts with something. It's a much better indicator of true interest than a simple page view. To dig deeper into this, you can find more insights on the top content marketing KPIs for 2025.
Common Questions I Hear About Measuring Content
Even with the best tools and a solid plan, you’ll inevitably run into some practical questions once you start digging into the data. Knowing how to measure content performance really comes down to how you handle these real-world head-scratchers.
Let's walk through some of the questions I get asked most often. These are the day-to-day challenges that pop up, and getting them right keeps your whole measurement process moving smoothly.
How Often Should I Actually Be Checking My Content Performance?
There’s no single right answer, but you need to find a rhythm that works for your team. From what I’ve seen, a monthly deep-dive report is the sweet spot for most businesses. It gives you enough data to spot genuine trends and make smart, strategic shifts without getting bogged down.
But you can't just set it and forget it for a month. I recommend quick, weekly check-ins on your most important campaign metrics. This is what keeps you nimble. It lets you make small adjustments on the fly, especially when you've just launched something new. For a big campaign, I might even peek at the numbers daily for the first week to either fix a problem or double down on what's working.
The point isn't just to generate reports. It's to build a cadence that supports both big-picture strategic thinking (monthly) and quick, tactical moves (weekly).
What’s the Real Difference Between a Metric and a KPI?
This one trips people up all the time, but the difference is simple—and incredibly important. Think of it like this: a metric is just a number you can track. It’s raw data.
- Page Views
- Time on Page
- Social Media Likes
- Email Open Rate
A Key Performance Indicator (KPI), however, is a metric you've hand-picked because it tells you if you're getting closer to a critical business goal.
For instance, ‘page views’ is a metric. But ‘conversion rate on our demo request page’ is a KPI. Why the distinction? Because that conversion rate directly measures if your content is doing its job of generating leads for the business. All KPIs are metrics, but only a handful of your metrics are true KPIs. Focusing on your KPIs is what stops you from drowning in data that doesn't matter.
How Do I Actually Measure the ROI of My Content Marketing?
Calculating the return on investment for content can feel like a fuzzy, impossible task, but it’s not. It's absolutely essential if you want to prove the value of your work. The basic formula is simple:
(Revenue from Content - Cost of Content) / Cost of Content = ROI
The tricky part is connecting a specific piece of content to actual revenue. This is where you need a good attribution system, often using tools like Google Analytics or your CRM to trace the customer's path.
Here’s how you can start connecting the dots:
- Lead Generation: Tag and track leads that come from specific blog posts, ebook downloads, or webinar sign-ups.
- Sales Influence: Look at which customers read a case study or a whitepaper right before they decided to buy.
- Content Cost: Be honest and thorough here. Add up everything—freelance writer fees, design costs, ad spend—to get a true picture of your investment.
Yes, setting this up takes some work upfront. But once you do, you have concrete proof of how your content impacts the bottom line. It's the final piece of the puzzle to truly understanding—and defending—your content's performance.
Ready to create LinkedIn content that actually hits your performance goals every time? With autoghostwriter, you can lean on proven templates and smart AI to write posts that connect with your audience and deliver real results. It's time to stop guessing. Try autoghostwriter today and see what a difference data-informed content can make.